↑ Use the top menu to view the project description.
<ESC>
Last updated: 05/09/2016
- Welcome to the exploratory site of the Sustainable Energy Transitions!
- Navigation
- You can navigate on this site using the controls on the right.
- Hit <ESC> to bring back this menu.
- Upon making a selection on the radio button and dropdown selectors
the main plot displayed will automatically change. - Using the <LEFT> and <RIGHT> arrow keys you can step in your last selection.
- Below the selectors you can find links to our previously published work.
- The project includes the development of dynamic net-energy models,
which are interactive and callable directly online - see the links on the right.
- Models
- The plots are generated using a dynamic net-energy model, SET 2.0.
- SET 1.0 is a simple implementation of SET 2.0.
- Both models are written in the AnyLogic multi-agent and system dynamics modelling platform using the JAVA programming language.
- Both of the models are open source and runnable live on the runthemodel.com online dynamic model repository.
- Plots
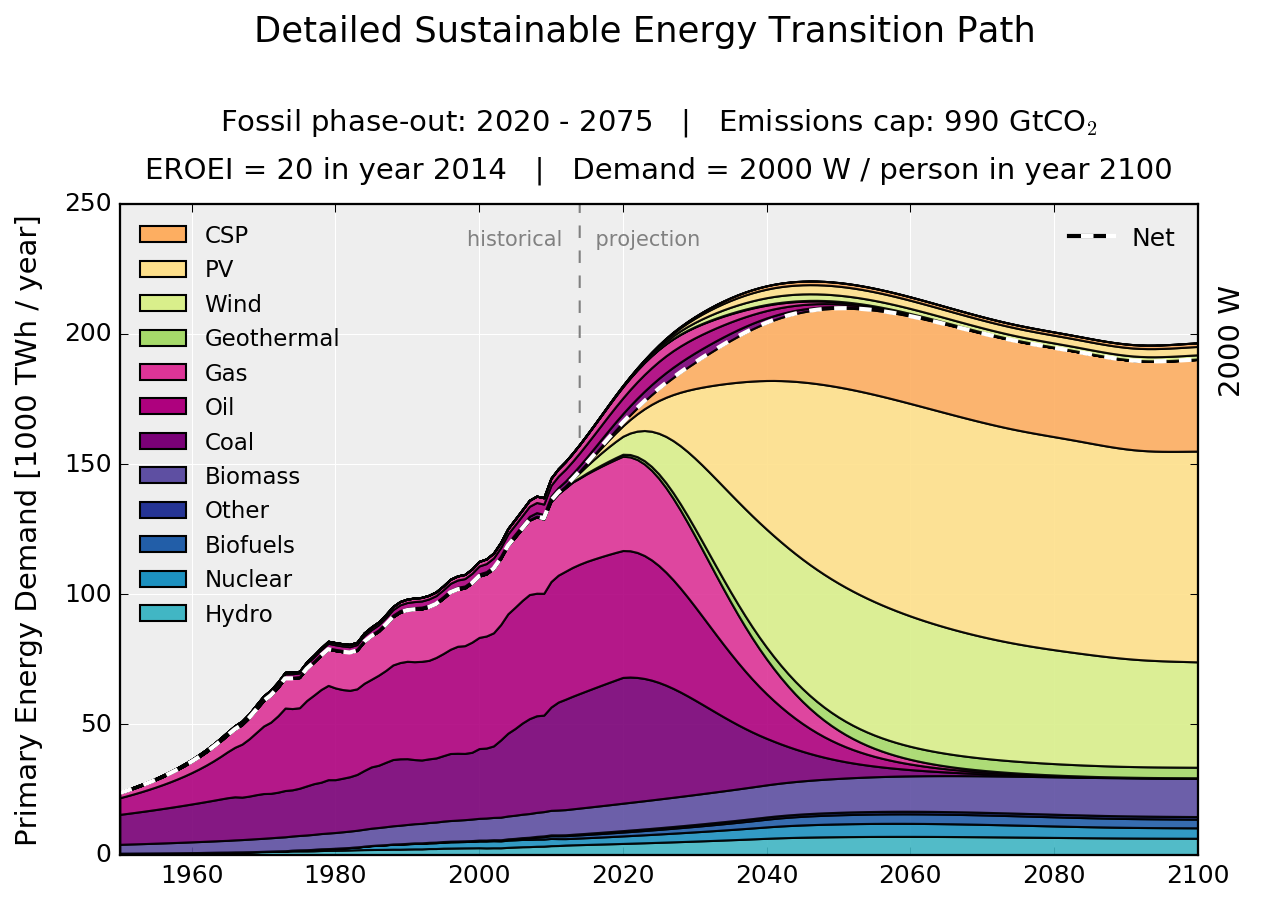
- This site presents the envelope of simulations conducted with the SET Model 2.0.
- You can find 3 radio buttons and 3 dropdown lists selectors in the top right corner of this page.
- Use the radio buttons to select the type of results you would like to view.
- The dropdown lists select the fixed sensitivity parameter. Upon selecting one,
contour plots over the other 2 sensitivity parameters are displayed in the plot area. - Below the selectors, you can also choose to display from a list of other relevant plots.
- Impact
- This work has resulted so far in numerous conference presentations and one journal article with another one in preparation.
- It also serves as the main topic for one doctoral dissertation and multiple master's theses under development.
- Shortly referred to as The Sower's Way, this work lead to the establishment of a mailing list and
continuously sparks extensive discussion in the energy-climate researcher community. - The Sower's Way concept is presented more extensively on http://sowersway.org.
- The SET Model 1.0 has almost 3000 runs and on runthemodel.com and multiple positive reviews.
- On the same platform, it has been selected the model of the month in June 2014.
- Authors
- This is a project by Sgouris Sgouridis and Denes Csala at Masdar Institute of Science and Technology.
Last updated: 05/09/2016
- Minimum resolution: 800 x 600
-


-


-


